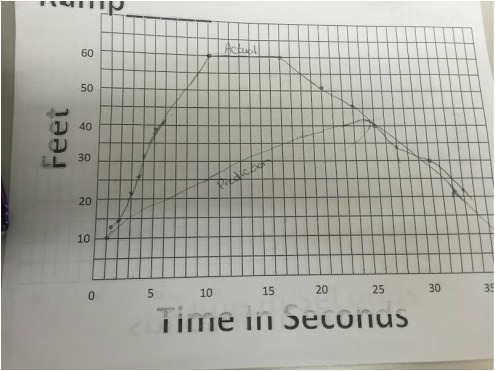
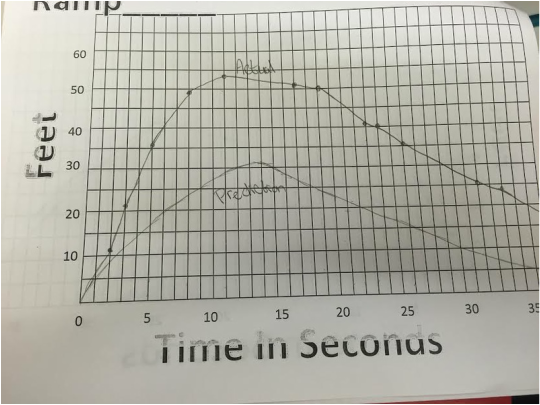
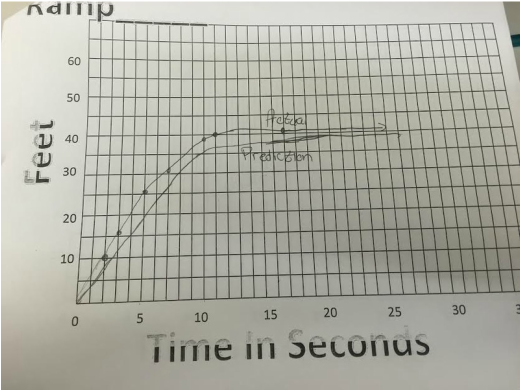
In the skateboard activity the assignment was to predict the graphs shape by watching the skateboard and how it moves with time and distance. My graphs were personally pretty similar in shape. My only difference was that my prediction did not go up in distance as fast as the actual ones did. Below I have posted what my three graphs looked like from this activity. The zeros of the graph represent when the skateboard is not in motion. The first graph shows that the skateboards went the farthest this time most likely because this is the highest ramp it was released from. All of the three graphs follow the same trend except for the different distance and time. When the graph is rising the fastest is because it has the most momentum because it was just let go down the ramp. When it is moving the fastest down it is because the skateboard was rolling back down a hill.
 RSS Feed
