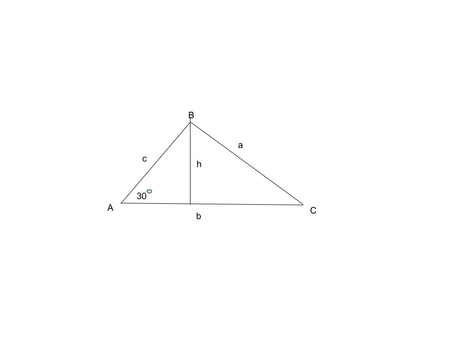
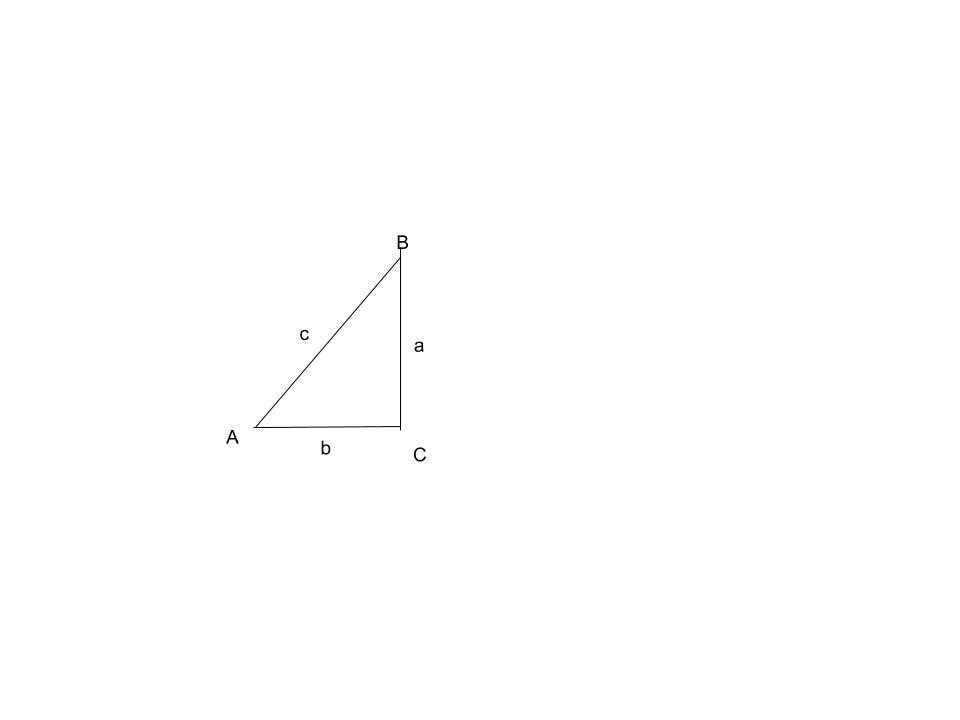
When you are given a side, side, and angle you cannot simply just put those numbers into the law of sines equation. This is because you do not know is there is one triangle, two triangles, or just none at all. When you have two adjacent sides and an opposite angle there is no definite triangle. To determine the number of solutions you must find the h in your triangle. You would first do sin30=h/c. If that number is bigger the h then you can have at least one and if it is between c and h you have two. If a is smaller than h you will not have any triangles. If you have two solutions then you need to solve two triangles. For the first triangle you use the law of sines to find angle C. so sin30/a=sinC1/c. Then you could find B by subtracting those two numbers from 180. Then you would use the law of sines one more time to find side b sin30/a=sinB/b. Then for the second triangle which is below A is still 30 and to find angle C you would subtract your first angle C from 180. Then find B with those two numbers and subtract from 180. Then to find side b you would sin30/a=sinb/b. That is how to solve a SSA triangle.
In this assignment I found out how to work backward to make a verification problem. It helped me understand how everything comes together to equal the final answer. It also helped with more practice because these equations are really frustrating at times. I basically just made an equation of the top of my head and then solved it to see what it would equal and then set them equal to each other.
This was an interesting activity/test because it was different from anything you ever do in a math class or just a class in general. It actually helped me make a lot of connections because I was doing the problems hands on which is how I learn best. I learned how the unit circle helps a lot with where the points for each function is located on a graph. Before the activity I did not understand how the unit circle even related to what we were doing but when working on this activity I learned that each spot like pi/6 can be calculated either using sin or cos and you can find what the y value would be at pi/6. I also learned how sin is the rise and cos is the run and I can actually picture it in my head of what that look like. Like sin(0) would be one because you go out 1 unit to get to the 0. So on the graph you would go to (0,0) and that is the point. When finding the angle on the unit circle you can find the point on the coordinate plane. It was very weird not to find out the answer to the problem and the Mr. Cresswell to just stand there and have no reaction but saying is that your final answer. It made me kind of second guess myself if I had done it right or if I was completely wrong. At the end when he asked if we wanted to make any corrections that was the worst part because I went through them all in my head to remember if we did them all right. In the long run though it was very helpful to see physically how the unit circle and coordinate plane go together. It was also helpful to see that we really could do it on our own and we succeeded.
A radian is a unit of an angle, whose arc is equal in length to the radian. To measure the circumference of a circle the formula is C=2pir. If r=1 C would equal 2pi(1) making the circumference 2pi. When the radian count is 3.1 you are half way around the circle. which is very close to pi. When you have went all the way around the circle the radian count is 6.25 which is basically double pi. This means that a full measure around the circle in radians is 2pi. Radians are just another unit to measure angles with like degrees. To convert to radians from degrees you multiply by pi/180. To go to degrees from radians you multyply by 180/pi. I think degrees is easier to use because I can just picture it better in my head. When I see something in radians then I have to try and convert it and in the process I may make little mistakes along the way. When in degrees I know how to start and can just go on with the problem. We must learn radians because technically speaking a degree is not a number and to do math you need a number. It is kind of like fractions needing to be in decimal form. So when con sidering which is more "pure" mathmatically speaking the I think it is radians.
Subsidized loans are loans that are available to students who need financial support. Your school determines the amount you may borrow and it can not go over your financial need. The U.S. Department of Education pays interest on subsidized loans. Unsubsidized Loans are available to undergraduate and graduate students; there is no requirement to demonstrate financial need. Your school determines the amount you can borrow based on your cost of attendance and other financial aid you receive. You are responsible for paying interest on these kinds of loans at all times. Private loans are offered by private lenders like banks and are used when you still have a gap between your cost of attending a school and the financial aid and/or federal loans that you have been awarded. Private student loans generally cost more than those you would receive from the federal government. To pay off a student loan of $20,000 with an annual interest rate of 4.2% with a monthly payment of $200 it will take about 123 months to pay it all off.
It would take 43 folds of a piece of paper to rwach the moon. This is because .005(2)^43=439,804,651,100 which would be how far the moon is from earth. This is unrealistic because folding a piece of about 5 times starts to get hard and diffuclt to make the paper fold. Also is the piece of paper actually got that big you would not even be able to reach it to fold it. The width would become very very small because every time you fold the paper in half you get half the size it was before. I guess it could matter because once the paper width got too small you would once again not be able to continue folding.
I learned from this activity what an even and odd function is and what they do. Both functions both have a certain symmetry to them. The picture posted below is what an even function looks like. It has a y- axis symmetry meaning you could fold it in half and have the same thing. This also means that the f(-x)=f(x). The second picture below is an odd function. It has a rotation symmetry which means that it if you rotate the graph 180 degrees it will be the same graph. This also means that f(-x)=-f(x). To find If a function is even you take the original equation something like x^4 and see is (-x^4) is the same with in this case it is. To find an odd function you take the original equation which is x^3-x and see if the f(-x) is equal to the -f(x). the worked out problem is the third picture down. In that case it is an odd function. Some families of functions are always even or odd functions. A cubic function is always going to be an odd function. A quadratic function will always be an even function. The only question I have is there any functions that are not even or odd?
The graph above appears to follow an exponential growth function. The graph below is the one I put points on to try and create a function that is similar to the one above. I used the function A=a^(x-h). Then I used sliders to move it around and go through my points the best as possible.
Below I put the equation I think represents the shot. To make this equation you need to know first how to make a quadratic formula but then to also be able to move it around. I think that the basketball will go into the hoop because when I followed the basketball down it lines up pretty close to going in. It either will hit off the back and bounce in or go straight in.
In the skateboard activity the assignment was to predict the graphs shape by watching the skateboard and how it moves with time and distance. My graphs were personally pretty similar in shape. My only difference was that my prediction did not go up in distance as fast as the actual ones did. Below I have posted what my three graphs looked like from this activity. The zeros of the graph represent when the skateboard is not in motion. The first graph shows that the skateboards went the farthest this time most likely because this is the highest ramp it was released from. All of the three graphs follow the same trend except for the different distance and time. When the graph is rising the fastest is because it has the most momentum because it was just let go down the ramp. When it is moving the fastest down it is because the skateboard was rolling back down a hill.
|
Archives
February 2016
Categories |