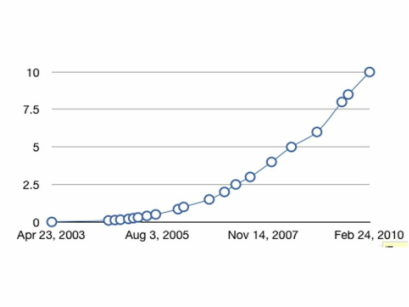
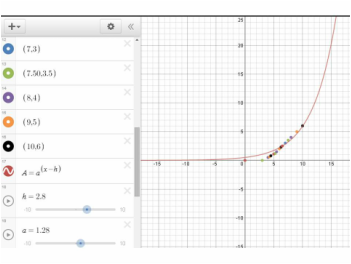
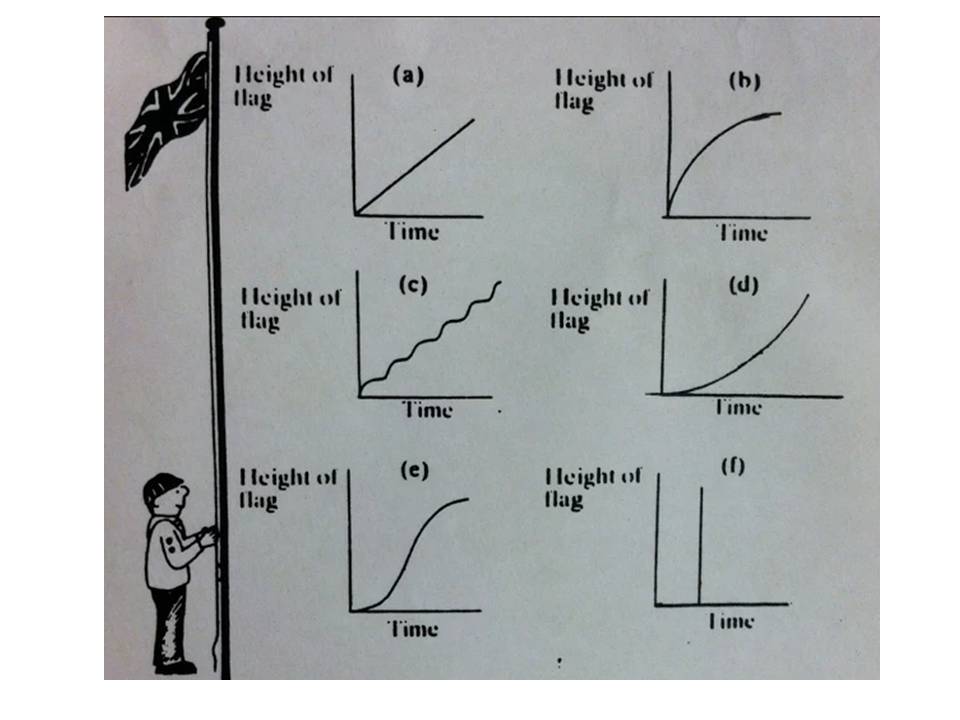
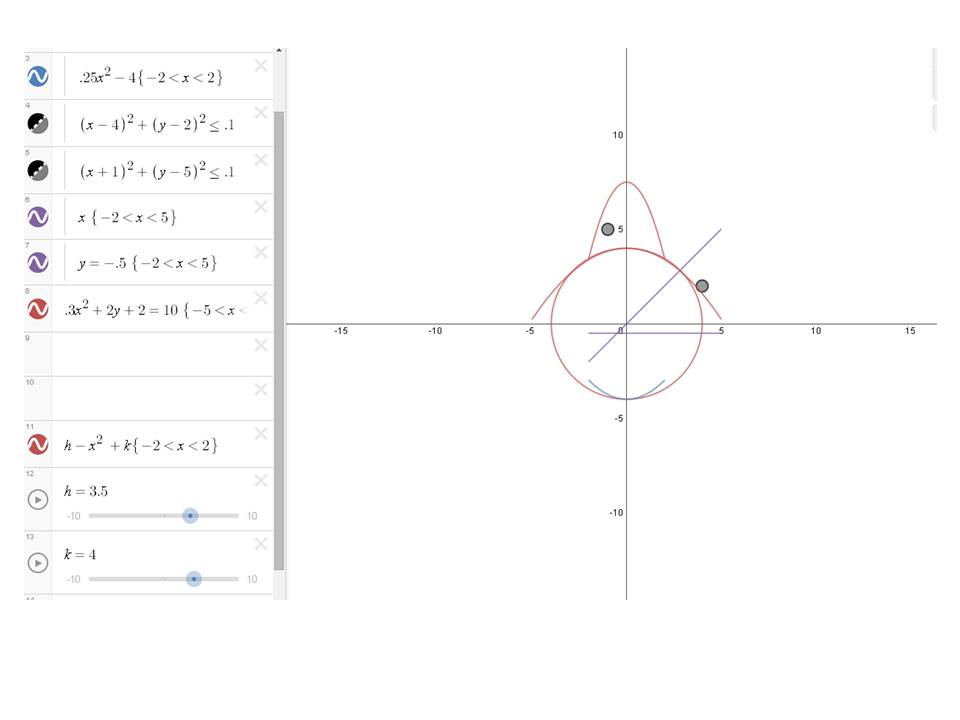
The graph above appears to follow an exponential growth function. The graph below is the one I put points on to try and create a function that is similar to the one above. I used the function A=a^(x-h). Then I used sliders to move it around and go through my points the best as possible.
Below I put the equation I think represents the shot. To make this equation you need to know first how to make a quadratic formula but then to also be able to move it around. I think that the basketball will go into the hoop because when I followed the basketball down it lines up pretty close to going in. It either will hit off the back and bounce in or go straight in.
In the skateboard activity the assignment was to predict the graphs shape by watching the skateboard and how it moves with time and distance. My graphs were personally pretty similar in shape. My only difference was that my prediction did not go up in distance as fast as the actual ones did. Below I have posted what my three graphs looked like from this activity. The zeros of the graph represent when the skateboard is not in motion. The first graph shows that the skateboards went the farthest this time most likely because this is the highest ramp it was released from. All of the three graphs follow the same trend except for the different distance and time. When the graph is rising the fastest is because it has the most momentum because it was just let go down the ramp. When it is moving the fastest down it is because the skateboard was rolling back down a hill.
Below I have put a picture of all the different situations of a boy raising a flag. Each one represents a different function for all the different ways the flag may have been raised. As you look at graph A you see that the flag was raised at an even rate over time creating a straight line up. In graph B the flag looks like it was pulled up pretty fast and near the end it started to slow down. Graph C looks like each squiggle is another stride up to raise the flag. Graph D shows that at first the flag was raising fairly slow and as it got closer to the top the flag rate became faster. In graph E the flag begins going up very slow and then speeds up and at the end slows down again. In graph F the flag gets pulled up in one pull. I think the most realistic graph would be graph C because when you pull a flag up it takes many different pulls. The most unrealistic graph would be graph F because no normal person could pull up the flag in one pull.
In the "Family of Functions" Packet I reviewed what I had previously learned in Algebra two. There are a lot of different types of functions examples of them would be quadratic, square root, cubic and logarithmic plus many more. These functions that I reviewed helped me in making my smiley faces look different. The first smiley face that is below is the one I made with not knowing what I was doing yet. I just changed numbers in the original functions and moved features on the smiley face. I also used a quadratic function to make the hair and the hat. The second time around I had reviewed all the different functions. It helped me learn and remember about all the different shapes of a graph they create. for an example a quadratic function creates a "U" shape. Depending if the number is positive or negative it could be upside down or up right. The smiley face below I made into a sunshine smile. I used a bunch of functions like "y=2x" to make the rays of the sun. The hardest part of the packet was just remembering all the functions I learned last year. I also found it challenging to remember what each number in the equation did like did it move it up or down kind of thing. The activity helped a bunch in recalling of what I previously had learned but had forgotten.
|
Archives
February 2016
Categories |